Tuesday, December 1, 2015

December Allocation

Here we go with a fast update with allocations for December
A comment will follow later in the week.
I just say now that I am a bit scared about huge currency exposure....

MODEL 1: euro govies 1-3 years or cash deposit 100%

MODEL 2: Treasury 7-10years 100%

MODEL 3: 50% Emerging Bonds $
                    50% Treasury 7-10years

MODEL 3.4 34% Japan Equity
                      33% Emerging bonds $
                      33% Global convertible bonds

MODEL 4 Europe
                     45% euro govies 1-3 years or cash deposit
                     11% Emerging bonds $
                     11% MSCI World (€)
                     11% Euro high yield bonds
                     11% Global bonds
                     11% Euro government bonds

MODEL 4 USA
                     56% US treasury short term
                     11% S&P500
                     11% Emerging bonds $
                     11% US government bonds
                     11% Developed Markets properties yield


----------------- UPDATE 7 DECEMBER -----------

As I feared, beginning of December showed a strong dollar reversal vs euro, and it is painful... model 1 will finish 2015 with a positive return, but model 2 and 3 have a full $ exposure....and it will rock&roll until the end of the year. Just hope that the dollar sell-off doesn't continue
By the way, I know that in the long term models will deliver positive expectations...
I just hope that a bad December will not delete the whole ytd positive returns.

I show below the returns year to date of the first 3 models


Model 4 in November returned 1% vs 2,1% Equal Weighted portfolio. In 2015 the return is 2,8% vs 9,1%. The model is underperforming when there's a bull equity markets, but is built to defend against sharp drawdown.

Model 4 US style in November returned -0,7% vs -1,7% EW portfolio. YTD the return is  -0,4% vs -2,2% EW.


Monday, November 2, 2015

November Allocation

Here a quick update with allocations.
In the week end I'll publish a comment with performance tables
These are the preliminary allocations

MODEL 1 - Euro govies 1-3 years (confirmed)

MODEL 2 - Euro High Yield bonds (changed!)

MODEL 3 - 50% Euro government bonds 15-30y (Confirmed)
                     50% Gold (changed!)

MODEL 3.4 - 34% Global convertible bonds (Confirmed)
                        33% Gold (changed!)
                        33% Japanese bonds (changed!)

MODEL 4 - 66% euro government 1-3 years (changed)
                      11% emerging bond $ (changed)
                      11% euro government bonds (Confirmed)
                      11% global bonds (changed)

MODEL 4 US - 66% US short term bonds (changed)
                           11% Emerging bonds $ (changed)
                           11% US government bonds (confirmed)
                           11% Global bonds (confirmed)
----------------------------------------
Follow up on 7 Nov with tables

I wrote down the allocation at the beginning of month, now I'm going to post the comments.
Because of some trends emerging in some assets, the models changed allocations. Except the MODEL 1 that is very conservative and switch only with a strong trend, in all other models we have some variations.

October was a positive month and until now all models are positive year to date. Below you can see the performance and the charts of model 1-2-3.


The model 4 performance ytd  (non in above tables) is 1.8% vs 6.9% equal weighted portfolio
The model 4 US performance ytd is +0,3% vs -0,5% equal weighted portfolio


A friend of mine asked me about model 4 and the fact the it rarely switches into equity. I built it to give better long term risk/reward and this is the way it works because i don't like big draw-down. But there's a version Beta that follow the long term trend in stocks and can stay into equity for many consecutive months. I'm not thinking at the moment to publish it because these 4 models take me time to comment. Moreover I'm working into a much bigger project at the moment to go long & short on futures and it's very time-demanding. By the way I don't exclude the chance to post the Model4.2 too starting since 2016.


Friday, October 2, 2015

OCTOBER ALLOCATION

Here we go with the allocation for October and comments.

Last month models enjoyed the cash allocation, avoiding the "hearth-attack" caused by market volatility. This month some of them try to be more active, even if the most conservative models (1&2) remained defensive.

MODEL 1 euro govies 1-3 years or saving sight deposit with a plus rate if available (100%)

MODEL 2 euro govies 1-3 years or saving sight deposit with a plus rate if available (100%)

MODEL 3   euro govies 15-30years (50%)
                     Treasury 7-10y (50%)
out from cash and eur high yield

MODEL 3.4 Global convertible bonds (34%)
                      euro govies 15-30years (33%)
                      Treasury 7-10y (33%)
out from cash, japanese bonds and euro floaters

Below you can see the table with monthly returns and relative charts. The year is still positive so far.


And now the last two recent models that have benchmark. I have to warn you that I found a bug in the benchmark calculations in the last 2 months (I hurried up too much while programming...). Basically benchmarks were overestimated because didn't consider last 2 months drops and asset returns were frozen. Today I hope...hopefully....that all is correct.

MODEL 4  Core government Eurobonds (11%)
                    euro govies 1-3 years or saving sight deposit with a plus rate if available (89%)
move a piece of allocation on the eurobonds

Model 4 September performance was +0,09% and YTD is +1,1%. The EW benchmark lost 1,3% and YTD is +2,4%. Benchmark is continuing to win, even if with higher volatility (DD around 8% this year)


MODEL 4 US: government 1-3y bonds (88%)
                          US generic government bonds (11%)
                          Global corporate bonds (11%)
Model try to add some longer term treasury exposure
Model 4US in September gained 0,5% and this is the YTD performance as well. EW portfolio lost 0,7% and since beginning of the year is losing 1,9% (DD -5,1% so far). In the US model 4 is overperforming.
 
CONCLUSION: I hope calculations are correct. It's not a good moment for me (not linked to markets at all) therefore forgive me if some bugs caome out. The purpose of this blog is also forcing myself to check often the models, because I must update  blog regularly.
Finally I also have a weighted adjusting version of model 3 that at the moment is overperforming in 2015, but I'll see if publish them in 2016 (i don't use it with my money because weight adjustment are to costly for a retail with my broker fees). I'm still working on a bigger model with almost 50 asset classes, but It will take time. Algorithms are ready, the difficult is the implementation.
Have a nice month


Thursday, October 1, 2015

preliminary October allocations

Just a preliminary preview of October allocations.I'm busy in these days, i'll check & verify better in the week end.
These are the allocations
Asset Allocation October

Model 1  euro govies 1-3 year or sight deposit
Model 2  euro govies 1-3 year or sight deposit
Model 3 50% euro govies 15-30y
               50% Treasuries 7-10y
Model 3.v4  34% Global convertible bonds
                     33% euro govies 15-30y
                     33% Treasuries 7-10y

Model 4   89% euro govies 1-3 year or sight deposit
                 11% euro core bonds

Model 4 US Style data not available yet

Sunday, September 6, 2015

September Allocation

Unfortunately my holiday were deleted and not because of financial markets....
By the way, I'm going to update with a short post the September allocation

MODEL 1 - Euro gov 1-3y or in alternative sight deposits with a plus rate (100%)

MODEL 2 - Euro gov 1-3y or in alternative sight deposits with a plus rate (100%)

MODEL 3 - Euro gov 1-3y or in alternative sight deposits with a plus rate (50%)
                      Euro high yield (50%)

MODEL 3.v4 - Euro gov 1-3y or in alternative sight deposits with a plus rate (34%)
                          Japanese government bonds (33%)
                          Euro floating rates (33%)

Below the table and the chart with monthly and year to date (YTD) performance


Corrections: In August allocation Model 2 YTD return was wrong. The real one was 5,06% (ie 5,1%) instead of 5,6% I wrote.Model 3 YTD was wrong as well in the table. The line graph performance was correct.


MODEL 4 -Euro govies 1-3 years or sight deposit with a positive rate (100%)
at the moment it continues to underperform  EW benchmark approx 6% this year

MODEL 4 US - US Treasuries 1-3 years (89%)
                            Global bond (11%)
at the moment it is underperforming EW benchmark by 0.8%.

it's normal it's underperforms in momentum reversal market. It's scope is to avoid huge losses over long term.

SUMMARY: in a market where momentum seems over, models are suffering but continue to be positive year to date. Now they are positioned very defensive expecting for a clearer direction in coming months. It's a pity that short term rates are negative for institutional and this mean losing money. As a retail people, is still possible to take a positive rate, or at least 0% on sight deposits

Thursday, August 6, 2015

August Allocations

Here we go with August allocations that are confirmed as I wrote fast in the previous draft.

MODEL 1: euro govies 1-3 years (if you can use cash sight deposit with a "+" rate)

MODEL 2: euro govies 1-3 years (if you can use cash sight deposit with a "+" rate)

MODEL 3:  1) euro govies 1-3 years (if you can use cash sight deposit with a "+" rate) and
                     2) euro high yield corporate bond

MODEL 3.v4: 1) euro govies 1-3 years (if you can use cash sight deposit with a "+" rate) and
                         2) euro govies floaters
                         3) global corporate bonds

All models recovered some or/all June losses in July continuing to be positive at the middle of the year. Most aggressive models recovered only a small amount of June losses.
Below you can see the table with monthly and ytd performance and relative chart


I want also to update the latest models (Model 4) that run versus a benchmark. You can find description in the post about MODEL 4 and MODEL 4 US Style. August allocations are:

MODEL 4: euro govies 1-3 years (if you can use cash sight deposit with a "+" rate)

MODEL 4 US: 1) 89% US treasuries 1-3 years (if you can use cash sight deposit with a "+" rate)
                          2) 11% S&P500

MODEL 4 performed 2,1% ytd vs 7,7% benchmark Equal-Weighted, therefore underperforming at the moment

MODEL 4 US performed almost flat ytd (0,2%) vs 0,9% benchmark return, slightly under-performing.
(note: since August Bloomberg denied access to previous govies 1-3y index, therefore I was forced to find another substitute that is not the SHY etf benchmark)

CONCLUSION: after a very good beginning of year my momentum models suffered the "back to reality" events, especially in April and June when there was many strong countertrend moves. Nevertheless all models 1-2-3 are positive in this 2015 covering ETF managements expenses and trade commissions
Most recent models (Models 4) are basically flat that isn't a great result. They're doing a bit worse than benchmarks
NOTE: September allocations will be updated with a strong delay because of my holiday. I think I won't be able to update it before 17-18 September therefore will be useful just for trackrecord but not for real monthly allocation. I'll stay cash with my money while I can't monitor markets.


Monday, August 3, 2015

AUgust Allocation draft

It was a busy beginning of week.
I made preliminary calculation for allocation, but couldn't check properly because of personal issues.

At the moment it seems that allocations are the same of July for Model 1-2-3 and 4 EU style
The model 3.23 assets changed something and I still have to open the US model

I'll update more in the coming days, maximum next week end

For sure model 1 and 2 stay cash, model 4 100% cash and model 3 confirmed HY & cash

Wednesday, July 29, 2015

MODEL 4 (US STYLE) - beating benchmark

In this post I show the US version of MODEL 4 (in the previous post it was from an € investor point of view)

I used 9 asset and calculated returns with the benchmark  of most traded US ETF
again the asset classes are:
1) Treasury 1-3 years
2) Treasury 10 years
3) Global corporate bonds
4) US equity S&P500
5) MSCI Eafe
6) Emerging bond $
7) Commodity generic index
8) $ High Yield
9) Developed Market Properties yield
I can give you Bloomberg ticker if interested

Chart below show that the US MODEL 4 beats the Equal Weighted portfolio in the long run


The table shows that over the long term risk-adjusted returns are far better than a simple EW portfolio. The model beats the simple risk-free rate (TBill 3months)


Like in the € version, MODEL4 obtains its overperformance thanks to the defensive position in bear markets. When there's a strong "risk on" environment, it tends to underperform.


July Allocation: 100% cash


Saturday, July 11, 2015

Model 4 - beating benchmark over the Long Term (updated)

 Note: I updated this post because I found a bug in the return calculation while building this same model with US ETF. Basically the return was wrong for €bonds 1-3years as I took another asset. With correct benchmark, the risk/return parameters improve, validating the strength of model.

In this post I want to show a model I developed that is different from the previous I posted.
While model 1, 2 and 3 were absolute returns models, ie trying to close basically positive in the long term, reducing downside risk, MODEL4 try to beat a benchmark  with a better risk/return

BENCHMARK
I suppose that my universe is composed by 9 assets that can be a proxy of major asset classes for an European investor. I replicate them with ETFs.

CASH:  as proxy I use Ishares € government 1-3 years because negative rates (in real as retail you can also use a sight deposit with positive/zero rate) 


BOND:  
  1. ishares Core euro government bond              (proxy for € govies)
  2. ishares JP Morgan $ emerging markets         (proxy for emerging market bonds)
  3. Ishares € high yield corporate bond               (proxy for euro high yield bonds)
  4. Ishares global government bond                    (proxy global bond market)
EQUITY
  1. ishares MSCI EMU                                       (proxy for euro equity)
  2. ishares MSCI World                                      (proxy for world equity)
 ALTERNATIVE
  1. Ishares developed markets property yield    (proxy real estate)
  2. Bloomberg commodity index euro               (proxy for commodity and benchmark for some Etf)
My benchmark is the equal weight portfolio (EW portfolio) with monthly rebalance (ie Etf has 11,11% weight)

MODEL vs BENCHMARK
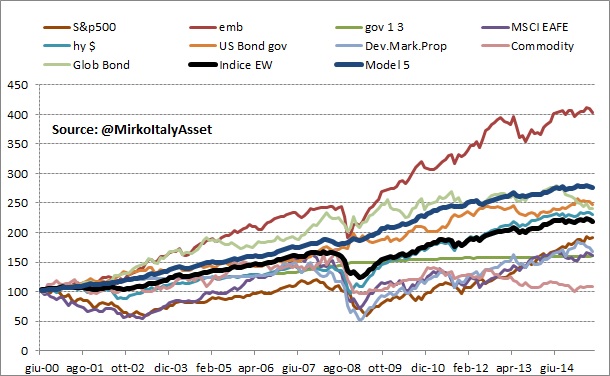
MODEL 4 is able to beat benchmark over long term mostly by reducing draw-down in difficult environments.

Below you can see the graph where the MODEL (dark blue) outperforms the EW portfolio (black line). You can see also the returns of others asset classes in the same period of time.


The table below confirms the outperformance. MODEL 4 returns approx only 1% a year more than benchmark over the long term, but the huge difference is the draw-down and the volatility.  MODEL 4 contain the max DD at less than 3%, while EW portfolio lost more than 27% once. You slept definitively better with the model even if returns are not much higher. And in the long term MODEL 4 (but also the EW portfolio) outperformed the risk free rate (Eonia).


PRO & CONS
I want to show a quality (and a defect) of the model. In the chart below you can see the ratio MODEL 4/EW portfolio. Basically when line rise the MODEL outperforms the benchmark and vice versa. You can see that there's a strong outperformance when there were stress on markets as 2007/08 and 2001/02. Instead when the market is in strong "risk on" phase, the MODEL tends to underperform from a simple return point of view.
This is a quality that I appreciate because it's "natural" and not overfitted.
My goal is always to find models that can continue to work in the future with high probability, therefore I believe that is important to not overfit. I have a clear trading concept, I put on place and don't go to see if modifying one parameters it improves. What I do is to have the idea and see if, changing parameters, the idea works with stable results.
If it doesn't work, it goes in the garbage. For example, I dont' use in this model moving averag, but just to explain the concept: if it works with 60days, doesn't with 100days, works with 120 and works so so with 200, for me it goes in the garbage :)


CONCLUSION
MODEL 4 in the past was able to outperform an Equal-weighted portfolio with 9 asset classes from an European investor side. Returns were not a lot superior, but the biggest difference is the more conservative approach that avoid the drawdown. I accept the underperform in the "risk on" situation because I know that with an high probability MODEL will outperform in long term with much lower draw dawn that help me to sleep better.

Just to be fair: Year to date the model underperforms the EW portfolio.
At the end of June EW  returns7,2%, while MODEL 4 returns just +1.6%. Therefore it shows that is not overfitted otherwise I would have posted a better result :)

Allocation for JULY: 100% euro government 1-3 years. Very defensive. Don't know how Greek situation will evolve, maybe I'll lose a relieve rally, but I sleep very well :)
I'll update it with the other montlhly allocation post every month in this 2015.


Thursday, July 2, 2015

JULY ALLOCATIONS

Here we come, 6 months after the launch of these models in the blog
Last months showed some trend reversal, especially in the bond world and models suffered. But so far all models are positive year to date, although many profits were gone.
In June MODEL 1&2 were on the defensive path. Unfortunately short term euro gov bonds lost value in that month, therefore there were small monthly losses (not if u invested in a sight deposit with positive rate instead of bonds).

These are the July allocations

MODEL 1 - Euro government bond 1-3 years (confirmed)
MODEL 2 - Euro government bond 1-3 years (confirmed)
MODEL 3 - Euro government bond 1-3 years  - euro high yield  (switched from emerging bonds and Treasuries)

I also want to show and track constantly  the MODEL 3.4 that I highlighted in previous post. It allocates on 3 ETFs each month. This is a bit more volatile than former MODEL 3, but adds diversification. Of course there are more switches and you need low commissions, otherwise is better the former model with 2 ETFs.
MODEL 3.4 - Euro government bond 1-3 years  - euro high yield - euro floaters rate (switched from emerging bonds, Treasuries and global bonds)

Below you can see the table with 2015 gross monthly returns and the charts.

Later this month I'm going to publish a new model, with different philosophy that is useful for a portfolio that want a multiasset exposure for most of the time.


Saturday, June 20, 2015

MODEL 3.4 3ETF 23 assets

In these last weeks many global trends had reversed (especially eurbonds), therefore momentum strategies are suffering. But we don't mind! In the long term these strategies pay and now it's a good time to research further strategies.
Today I post the results using the same MODEL 3 algorithm, but  selecting 3 ETFs each month in an universe of 23 ETFS, mostly Ishares. All are listed on European markets with € as currency.
In the chart pie you can see the allocations weights since 2001. It invests broadly on many assets and is the most aggressive model among the 3 I previous I showed here.(Model 1 and 2 are more conservative, in fact they are allocated on short term euro bonds in June)


The table below shows returns with risk measures. It's not bad. In 2015 at the end of May model gained a little above 6%, but in June is giving back further profits.


For June model allocated Japan equity, Emerging bonds $ and Global convertible. It's suffering...

Tuesday, June 2, 2015

June Allocation

Another month passed with models that try to defend the gain accumulated since beginning year.
Model 3 is giving up something but is still very positive ytd.

Here we go with the June allocations that switch defensive on the first 2 models

MODEL 1 - € Government 1-3 years (Confirmed for the third consecutive month...it doesn't like volatility)

MODEL 2:  € Government 1-3 years (the model left the € HY allocation and go defensive for June. Last time it was defensive was October 2014)

MODEL 3: 50% Treasury 7-10 years - 50% Emerging Bonds $. Model lost money with inflation bonds in May, recovered something with HY. Now it takes  an high $ exposure.

Below you can see the monthly performance calculated using benchmarks


I built the extended version of model 3, now up to 23 assets.
In June I'll make a post on it.
Have a good month.


Saturday, May 9, 2015

may allocation follow up

This morning I updated the post I wrote last week end with table and further considerations

Monday, May 4, 2015

May Allocation - preliminary

I am quite busy at the moment.
I couldn't update in the week end because last week moves were "strong" and I needed to download data instead of doing a proxy for last month day like usual.
It was a "decimal game".

I'll write more in the week end. At the moment I just post the new allocation

Model 1: € government 1-3years (defensive)
Model 2: € High Yield
Model 3: € Inflation bonds + € High Yield

The models abandoned the € government 15-30 after the strong fall at the end of April
there were losses, but still in positive YTD.

keep in touch

______________________

Updated on 9 May 

After a very busy week that showed a very strong volatility on Bonds markets, I'm going to update the table with performances.
May didn't start good for monthly allocations because both high yield and inflation bonds suffered from the huge stress in European market.
As I posted on Twitter, because of very high unusual moves and volumes, the probability of a short term bottom is very high.

But trend could be definitively changed this month and investors needs to be on alert on Bonds (especially in Europe) with stop losses in particular on the longer maturities.
By the way, these models don't have an "intra-monthly" stop built in them, but the stop is implicit at the end of the month if the allocation changes.
Let's see the performance in April that basically deleted the very good March's results. All models are in positive but 2 months ago i was happier.


Sunday, April 26, 2015

Working progress on model 3.

I expanded the model 3.3 up to 21 assets with results that continue to be solid without optimization. Beginning from Summer, I think that this model will be my new one with real money (now it's the classic model 3 that you can find in this blog).

It's also ready a variant of model 3 that I'll call model 4, with same rules but completely different time frames.
The correlation between the two models is positive and high (70%), but not too much.

I'll post them in May, when I'll have free time. I am also looking for other 1-2 Etfs candidate that are quite liquid (i just need tight bid/ask not volumes), enough track record for the benchmark and low correlation with most assets. I could also try to see how some short equity  Etfs work even if these models are not thought to go short.

Next week I'll post the new May allocation within the week end

Sunday, April 12, 2015

MODEL 3.3 (Beta test) 3ETF 18 assets

I'm continuing developing a wider version of model 3.
At the moment asset correlations are increasing between stocks & bonds because of Central Banks liquidity. My target is to build a model with wider ETFs that, hopefully, will be able to resist and limit losses when the next crash will come within 1-2 years. On the other side I don't want to stay aside from markets hoping in better market metrics because often the better gains occur in the last part of the bubble (think about 1999).

This is a beta version and at the moment I'm not investing my money on this, because I always like to see it in real for at least 6 months after developed to see how it works and test if there's some formula bug in the excel file.

Basically it's the same "engine" of model 3, with these differences:
* It invests in 3 ETFs each month instead of 2
* ETF Universe is composed by 18 assets instead of 10.

All of them are listed in Italy but you can find them in other European Exchange such as Frankfurt. Just to clarify a doubt that one reader expressed to me: they are listed in Europe and are not hedged. That means that if I invest in US Equity, my performance is the sum of US Equity in local currency + $ performance vs €.

You can see the ETF universe (all Ishares) in the graph below and see how the model allocated money since 2001.


A problem I have at the moment is that many ETFs are recent and there's not enough track record to test them (or are illiquid).Therefore I find difficult to find other assets to add. For example I'd like to try some smart beta one, but is impossible at the moment.

Here is the performance of the model 3.3 on the hypothesis that I buy the benchmark index at the end of each month. Of course in practice the real performance will differ for slippage costs, bid/ask, capital gain taxes, difference between nav and price, commissions, but this is an interesting starting point in my view.


Allocations in 2015 were:
Jan Govt 15-30 / Treasury 7-10 / UK Gilts
Feb Govt 15-30 / Treasury 7-10 / UK Gilts
Mar S&P500€ / HY $ / Developed Markets Properties
Apr  Govt 15-30 / Gold € / UK Gilts

This is a work in progress because I'm going to add further assets.
The next step is to add many type of Govt (different maturities such as 1-3y, 5-7y, 7-10 and 15-30 and longer if available for euro and US) and corporate bond but I need to prepare the formulas to solve some problems with correlations. It will take time, but hopefully for the Summer I'll have a model that select among 30 assets.I'm also looking for other types of ETF to add other currencies exposure but it's not easy to find something in Italy outside of $, sterling and yen.

I remind that the target of model 3 is to take its risk, also exposing to losses around 7-8% in a month in exchange to obtain interesting risk-adjusted returns over the long term (an alternative to the pure equity investing for my portfolio). Sincerely I don't believe too much in the buy&hold unless you dont' buy in recession times...but it takes good guts!


Friday, April 3, 2015

April Allocation

March...what a great month!! It finished with a very good performance, even if I feared it because invested in overstretched assets. But this is the momentum power and the strength of trend follower methods. They are going to reward until.. the trend doesn't end. But who can say when it will finish?  We could be in a year like 2007 with strong fall coming in equity markets in the next quarters. On the other hand with all liquidity around, we could be in a market like 1998-99, where there were huge gains even if with bubbles all around. Personally I think that there's a bubble in Euro government bond, it's insane to have negative yields.  But I'll continue to surf market (and euro bonds), being conscious that at some point I'll have to take stop losses on the most recent trades.
Let's go and comment with the new allocations.

MODEL 1: it was allocated 100% on the US Equity. It closed with a gain higher than 3% thanks to currency effect. I remind you that all my strategies are elaborated by an European point of view with currency un-hedged. The new allocation for April is Euro Government 1-3years. Basically the model take profits and go conservative. If you can have a positive rate on a sight account this is the month for it. I have Conto Arancio at 1% ad I'll go on it.

MODEL 2: this model invested in US equity as well taking advantage of Dollar strength. The new allocation for April is Euro Government 15-30 years. This model is more volatile than Model 2 and finds extra performance in another stretched market.

MODEL 3: it invests in 2 ETFs each month. In March it was invested in Treasury 7-10 years and euro govies 15-30 that had both good performances in euro. In April the model confirms the euro government 15-30years, but switches from Treasuries to Gold. It's the first time since March 2014 that model invest in Gold and I must admit that it lost money in the previous two gold's allocations.

This is the table with monthly and ytd performance. It will be difficult that the 2015 will continue like in the first quarter.


Summary: all models are going to modify the asset allocation in April. 
Model 1 will invest in Euro-gov 1-3 years; 
Model 2 will invest in Euro-Govies 15-30 years; 
Model 3 will invest in Euro-Govies 15-30years and gold.


Sunday, March 8, 2015

Model 1-2-3 - In practice with Markowitz

Since beginning of the year I described 3 models that I'm using at the moment.
Others are W.I.P (work in progress) therefore I don't want to mention them in this post.

Today I want to show how to combine my models to decide the % of portfolio for each one.

I'm going to use Markowitz optimization thanks to an excel written by Ravi Shukla.
http://myweb.whitman.syr.edu/rkshukla/Essentials/

Below I report the expected returns, standard deviation and correlations of 3 models
Constraints: no model can weigh more than 60%


 Then I ran an optimization looking basically for 3 theoretical portfolio:
- Constrained min. standard deviation
- Maximize expected return in a range 5-10%
- Max CAL slope assuming cash rate 0.3%.


You obtain 3 possible portfolios with different weights
For myself I prefer using the first on the left that gives
60% Model 1 - 16% Model 2 and 24% Model 3

I also keep some cash for discretionary strategies because I must optimize the fiscal side. In Italy Etfs are penalized because I can't compensate gains with losses, therefore I need other instruments to recover losses.

Finally someone could also use the portfolio that maximizes CAL (Capital Allocation Line) to move along the black line and rise expected returns or lower standard deviation reaching points not available with the efficient frontier. This is built with a +0.3% cash rate at 1 year.


Saturday, February 28, 2015

March Allocation

Here we go with March allocation. 

MODEL 1: US Equity (from Euro Govt 1-3years)
MODEL 2: US Equity (from Treasury 7-10y)
MODEL 3: confirmed 50% Euro Govt 15-30 and 50% Treasury 7-10y.
MODEL BETA 3.2: 34% Euro Govt 15-30, 33% Treasury 7-10y and 33% US Equity (not real yet, just backtesting and studying)

Because these are un-hedged positions, the portfolio has an high $ exposure.
the portfolios shifts heavily into the stock markets, Model 1 allocated 100% on equity for the first time since 2005!

These are the results for February and Year to date.
Except Model 1, all other models had negative performance in February.
Because of very high January returns, portfolios are positive year to date.


Have a nice week

Sunday, February 22, 2015

MODEL 3.2 Beta Version - More Etfs more assets

It's my pleasure to introduce an beta version of model 3 that I'm going to call MODEL 3.2
It's has a correlation about 80% with the "pure" model 3, because the logic of algorithms is the same
Therefore one can decide if use both or just one of them.
Basically there are 3 majors changes:
* 2 more assets (UK Gilts and Asia Pacific dividend shares)
* 1 more ETF each month -  model buys 3 ETFs rather than 2.
* Different time frame to calculate the market strength

Below the results (without including commission and slippage)


What I like is that:
1) again is not hyper-optimazed. I found another model much better with the same idea but I rejected because too optimized. I like that model 3.2 give similar results changing the variables and time frame over the long run, and this mean consistency for me;
2) even if the purchase of 3 ETFs a month means more commissions cost, you add diversification. It's not rare that in one month you see one ETF dropping a lot, compensated (all or almost) by the two.
3) the model invests on all 12 assets in the long term


Summary: this model is still in beta version, meaning I'm not investing real money with it. 
I want to investigate further in coming weeks and then beginning to use it
Must decide if/how combine it with the other three models to find the right weight. I think I'll publish a new post in coming weeks about how to use Markowitz to decide the model allocation.
I am also thinking about a version 3, with up to 5 ETFs each months and 20-30 asset to choose. But have to think how to filter correlations with a bigger number.
ALLOCATION: in January model selected  Treasury 7-10y, Euro govies 15-30 ad UK Gilts. January allocation was confirmed for February and this month lost some of January gain so far.


Monday, February 2, 2015

February Allocation

This 2015 began very well, with more aggressive models delivering solid gains
Basically one could also go flat for the rest of the year and be happy....
But it's not my style, therefore here we go.

MODEL 1 - Euro Government 1-3 years
The Most conservative model continue to be defensive and stay on the short end of the curve. If you are a retail, you can invest on 1month deposit. In Italy you can have 1% a year with one international Bank. At the moment with my saving I'm using it instead buying this Etf that yield basically zero.

MODEL 2 - Treasury 7-10 years
In December was invested in the long term euro curve with govies 15-30. In February the model switchs on the Treasury 7-10 years

MODEL 3 - Euro govies 15-30 and Treasury 7-10
It's the same allocation of January and had an high return.

Below the table with returns in 2015


Saturday, January 24, 2015

TRADING IDEAS - POSITIVE ON EUROSTOXX 50

This is a new section of the blog where I share my view about possible long term ideas .
With the label "Trading ideas (no model)" I write ideas based on my own judgement and not my models.I can cover all assets I can trade worldwide.
the first idea for this year is a trade bullish on Europe, in particular the index Eurostoxx 50.

Recent move from ECB makes me optimistic on Eurozone equity for the next 4-6 months.
Even in the case of Tsipras victory in Greece, I think equities will be able to contain the short term volatility (buy on dip).

Based on recent history (US & Japan), QE had a good effect on equities at least for few months.
Charts shows the multi year breakout of the index thanks to expectations (realized later) about ECB new monetary policies. Moreover Draghi talked about QE effect to raise equities and real estate (it says like a statistic of past QE, I read it like its target)
If ECB is able to keep rates and € low for other months, we could have positive surprises from European earnings this year for Q1 & Q2 season. I am not sure we'll be able to beat deflation, but in the middle of the year market could believe it's possible and reward stocks.


HOW I AM PLAYING IT
Don't know if models will shift to euro equity at the end of the month (see the end of post for further considerations), but I'm going to try this trade for the 2015

My ideal target for the year is the range 3.900-4.400. Don't know if will take months to be touched, let's say that I believe the lower band will be touched in 2015.
Here how I'll play it (unless Greece elections change my mind in the short term):

  • Usually European indices moves in a zig zag style. It means that you have positive weeks followed by 1 negative even if there's an uptrend. Last week was the second consecutive positive week, a third one is not likely, a fourth one is very unlikely...
  • Because "zig zag" I'll start with a conservative approach. I'll sell put 3 months (April)with strike in the lower orange area. Level 3000 is the area for income, level 3200 is my ideal entry levels. These will be my strikes.
  • I'll also enter a long position in 3 steps: 1st next week 20%; 2nd and 3rd if there's a pull back, 40% each. 

I think this is a conservative approach for a quite long term trade (if things don't go bad...). I could also go long 100% next week, but it's not my style enter 100% in one shot. Another possible plan would be to go short put otm and long call otm, with a long maturity. Don't plan to do it for myself.

STOP LOSS - As things can always go bad....I'll place stop losses below 2790 (October low) for optioons and below 2900 (December low) for the long

NOTE: if models 1-2-3 will go long euro equity (Dax or Ftsemib) for February, then my long strategy will be limited to put and I'll close my 20% long.
NOTE 2: as always, these are my considerations and if you follow me, you'll be responsible for your investments. 

Saturday, January 17, 2015

MODEL 3 - I WANT MY RISK

This is my third model, the one I appreciate most as an alternative to the pure B&H equity allocation.
I think  it can deliver more consistently in the long term, reducing the "ruin risk" (excluding one black swan event that can happen suddenly every moment).

Basically MODEL 3 invests in the same 10 ETF of MODEL 2 with a different approach.

  1. Dax
  2. Emerging Bond in $ 
  3. Euro inflation bonds
  4. Euro govt 1-3 years
  5. US Equity
  6. Ftsemib
  7. HY Euro corp bond
  8. Gold 
  9. Treasury 7-10 years
  10. Euro govt 15-30 years
All asset return are calculated from an € investor point of view (me) and ETFs reflect both asset performance and currency effect. To simplify the calculation I used the benchmark value (total return index).

At the end of each month the model allocate on 2 ETFs (the first and second in the rank), adding more diversification than MODEL 1 & 2.
The chart below shows how the model selected its allocation among all ETFs since 2001 . I appreciate a lot this model because I think is quite flexible and reactive to the events.
I also noted that with 2 ETFs I have much more consistent results instead of just one, even if commissions arise of course. Is not uncommon to see in one month ranking 1 etf dropping, while ranking 2 rising or viceversa.


The table shows annual results. Of course in real they will differ because you have commissions and slippage, as you won't always be able to get the perfect entry price. Moreover there's the market maker bid/ask and you'll pay taxes on capital gains reducing the benefits of coumpounding returns. But I think that in the good years you'll be rewarded regardless.


In the chart below you can see the gross performance over time.
I want point to two factors:
1) MODEL is not hyper-optimazed, because I want it real.
2) THE IMPORTANCE OF "FAITH".


As you can see you have some bad periods even if the the Yearly return table everything looks nicer. You can have long periods of flat/negative returns (2002 to part 2003 & 2006 to middle 2008) and also some bad corrections with consecutive negative monthly returns.
Because of this, faith in your model is essential and you must continue to follow it.

As I wrote in my introduction, investment is like agriculture. You have good and bad years (you don't know earlier, you can only suppose and/or hope) and you must follow a method that: a) rewards in good years; b) limit losses in the bad one.
Nobody knows how 2015 will be, many assets are quite overextended (especially in the fixed income) and could be a year either as 1999 (stock bubble foam building up...) or 2008 (crash).  This week SNB's move shows that 2015 isn't a normal year.
I believe that approaching it with an active model, fast to react to changing developments will be the best choice.


In Summary: this is my favourite model for an higher risk taking part of portfolio and is not hyperoptimized.
It selects 2 ETFs each month in a 10 ETFs'universe. 
Even if it had its bad years, it delivers consistent returns in the long term.
NOTE: allocation for January: A) 50% Treasury 7-10years B) 50% Euro Govt 15-30 years


I plan to build over 2015 an evolution of this model that can choose among 30-40 assets, but it's still at an embryonic state (it will take months...like a baby)


Saturday, January 10, 2015

MODEL 2 - PRUDENT WITH BRIO

This is the second model I developed. It's based on the same algorithms of MODEL 1, but allocates within 10 asset classes instead of 7.
Basically I added the gold (in€), Euro government 15-30 years and Treasury 7-10 years.

The table below shows that yearly returns improve with more assets, in line with more volatility.
The model loses money in some years (2007 and 2010), but is a winner in long term.


In the pie-chart you can see the allocations: again you have zero allocation in some assets such as Dax, Gold and Inflation bond. Equity allocation continues to be very low and most of time is a choice between Short term bonds, Govies € or $ and High Yield/inflation bonds.

Because of the low equity allocation, MODEL 2 is quite defensive, but more aggressive than MODEL 1


Finally graph shows that MODEL 2 (INDICE) outperforms all other assets in the long term (taxes on capital gains and commissions not included).


In summary: MODEL 2 is more aggressive than MODEL 1, but still conservative because most time is on bond. Increasing asset universe led to higher returns, with a small increase in volatility.
One cons is that it the low allocation on equity (and none on gold) therefore I'll do further studies in the future to see if I can find other assets that improve the model. At the moment I'll let it run with the original setup.
In the next post I'll describe my favourite model, that is quite more aggressive and based on a different setup, but still quite conservative (as I am).
In the future I'll also explain how different models can be "diversified" in a single one to obtain a good strategy. But I'll let this for next months.
NOTE: for January the model is allocated on € government bond 15-30, in line with December position

Tuesday, January 6, 2015

Introduction


I am an Italian professional working as Strategist in a bank,
I have a passion for markets and decided to open this blog to write my thoughts, ideas and explain how is possible to approach markets as an investor point of view.

I see the markets like a farm. You must know the product you're going to cultivate (pros & cons), find a method that is expected give you a positive result and finally realize that non all seasons (years) are equal.

Like a farmer you can have good years and bad year (not depending by yourself but due to exogenous factors)- Is important to understand that you must be prepared for the bad year trying to limit losses and exploit the good ones.

In this Blog I'll show some of my methods I built over time to decide my asset allocation, most of them based on the momentum.
Past results are not a guarantee for the future, but they make sense that can continue to be profitable in the long term, even if can happen 1-2 year of bad performances.
I realized in these years that to be able to have solid results, you must diversify models (like with assets), exploiting the low correlations

In the coming posts I'll show some models I built, but please don't write me to ask for algorithms. I consider them as proprietary copyright.
Once i explained one model, I'll begin to update it every month with the new allocation.
You can read this blog as starting point to create your model based on your risk aversion. As i use them for my core wealth, my models are quite prudent.

Enjoy the blog and let's hope 2015 will be a year with a good harvest...even if we came from a very long bull markets in US.
Let's begin with this tracking in real time for 2015.
NOTE: Even if I give monthly allocation, you're deciding to invest at your risk and I  don't feel myself responsible for eventual losses. I'll be already losing on my own...


MODEL 1 - THE PRUDENT INVESTOR

This is my oldest model based on momentum and filtered to keep volatility very low.

At the beginning of the month, the model selects one of 7 asset class, allocating 100% of capital.

As asset I use Ishares ETFs listed on Borsa Italiana
1) Government 1-3 years 
2) Italian equity (Ftsemib)
3) USA Equity (S&P500 since 2003)
4) German equity (Dax)
5) Euro High yield (since 2005)
6) Emerging bond $
7) € Inflation bonds

The chart shows the model index (INDICE) vs other 7 assets. I didn't include transaction costs. Model 1 outperforms all 7 asset but Emerging Bonds in hard currency.


The table shows yearly performance since 2001 with some risk parameters (no cost included). You can approx take out 1% a year because of the low turnover of the model. Basically it never closed a year in negative, even if  returns 2012-13 weren't high.


In the graph you find the asset allocation since 2001. Model 1 was conservative going on Governatives 1-3 years most of time, with Euro high yield bonds at the second place.
It's a result of the low volatility filter I used that often excluded equity and Emerging bonds.


Summary: this is my oldest model. In the past I used it for my core portfolio.
Because it often allocates in the short term bonds (now yielding 0.3% with 0.2% Etf expense), it's important to add a second model that diversifies assets.
Stay tuned for next update with the evolution (already working in real)
NOTE: Model 1 January allocation is again on Eurogovt 1-3 years