Friday, December 16, 2016

PERFORMANCE NOVEMBER

Here the models performance in November and YTD.
Even if november wasn't positive for all models, I'm very satisfied.. December is good so far...hope markets will hold these levels until the end of the year


Saturday, December 10, 2016

THE WEEKLY VIEW - S&P500, TREASURY, GOLD, EURGBP

Disclaimer: In this post I write my opinions and trading idea (not always in line with my company). If you choose to act like me, you are assuming your responsibility for your investment decisions, because I could be wrong as every human being.

After about 1 month since the last weekly view, let's see what's going on medium term in some assets I monitor

S&P500
In the previous post I pointed out the risk of a bearish weekly signal looming, that could lead to higher volatility. After few days, S&P500 reversed and began to rise fast, therefore the sell signal never materialized.  So there's not motive to be bearish.
At the moment the market is in strong uptrend, probably quite overbought and could correct. Probably the first dip could be used as entry point, around 2165-2190.

GOVERNMENT BONDS
In the previous post I wrote that the ETF GOVT was dropping towards an important support area. It reached the area where one can begin to buy for a rebound. Personally I stick with the last comment, ie I'd try to buy at 24.5 and sell 0,80-1$ higher.
Medium term is short at the moment, but a rebound could have a target around 25.25-25.50 .

GOLD

In previous post I pointed out to be a buyer a 1150$. The idea is still valid, even if something fundamental changed. ETF gold holdings are dropping fast, signaling institutional investors are exiting. Moreover China and India could reduce demand to fight tax evasion (Indian) or put a brake on capital outflows (China)
From a fundamental point of view, Gold is weaker than few weeks ago.
Because I have a permanent long term position on Gold and fundamentals are getting worse, this time I'll avoid buying at 1150. I have a buy order around the bottom of 2015 in area 1050 for trading.

EURGBP
I confirm what I wrote in previous post and also wrote on Twitter few days ago when it was around this week bottom.


Medium term trend is still up on eurgbp above 0,83-0,80. I reduced long sterling positions below 0,84.
Above 0,87 I'll add other positions, better at 0,90 eventually using EIB 2018 or 2019 gbp bonds to reduce interest rate risk.
In the case of a drop towards 0,80, I'll sell all my sterlings.
Unless a very strong devaluation of pound (rise of eurgbp) happens in the short term, I won't add sterling exposure before Supreme Court result in January.

For this week is all, if you are interested in my idea about other assets, just drop me a message here or on Twitter.

Friday, December 2, 2016

DECEMBER ALLOCATION

Here we go with the last Monthly allocation for 2016.
So far this is a year of satisfactions

Most defensive models switch to safest short term bonds (if you can go on sight deposits to avoid negative rates). Most aggressive models continues with $ exposure and stocks


Saturday, November 26, 2016

Dollar Index - much higher in the long term?


As I often write, I like long term patterns to understand what's going on structurally.
The recent Dollar Strength pushed the €/$ below 1,06 with many commentators wondering if parity is coming soon.

In the short term dollar is quite overbought and could rebound, but what's going on under the surface?
Let's have a look at the dollar index and the long term chart show us a big risk of strong dollar appreciation in the future.

After almost 2 years of trading range, recently DXY rose above the important resistance 100.40
It's a monthly chart, therefore the eventual break-out will be confirmed on the 30th November.
But the chart lets me think that something big is going to happen in the next 1-3 years


Fundamental explanations could be many: 1) crisis in Europe 2) political monetary divergences between Fed and other major central banks 3) China collapse and flight to quality towards dollar 4) Global recession with the same flight to quality 5) Trump infrastructure plan, economy surprisingly strong in US and Dollar purchases 6) wars, etc etc etc.

We can find many motivations and it's difficult to say now what will be the cause. I think that in the next 12-24 months there will be a G20 meeting about the excessive Dollar strength and we could see another "Plaza Accord"(click for info)

Of course the opposite could happen: the breakout finishes in a "Bull trap" and this is going to be the multiyear top for Dollar. Because Bull traps exist and I could be wrong, this is my strategy. I am a Dollar Bull thinking since 2 years that €/$ parity is the "at least" the first target. Because of European situation I think we could see 0,90-0,85 within 2020.
But I also know that I could be overly pessimistic, so the strategy is:

a) Long term chart points to Dollar Strenght with first target on DXY at 104 and major swing target around 112-114
b) I expect (but could not happen ) a short term pull back (from 1 to 6 months). Therefore Dollar could return below the resistance and then to surge later
3) My Bullish Dollar plan will take a stop with DXY falling below 91. In that case the breakout would have been a failure
4) Optimal pull back should not see DXY to retrace below 97
5) Finally reminds that in the long term view, this bull trend will be over only below 80. Of course if this happens...the above called target probably won't be realized in the next years.

Let Enjoy this ride, remembering that excessive Dollar Strength will cause problems in the World (non only in the USA, but Asia and Emerging Countries), so be prepared for asset volatility if next leg up accelerates in 2017-18.


Sunday, November 20, 2016

OCTOBER PERFORMANCE

Here the performance for October, where one model had a bad draw-down and now is just in light loss ytd
Others continues to perform well.


This month is quite volatile, let's see how models will perform. I'm quite happy that global rates are rising on the long maturities, hope it will happen in the short one to re- normalize the markets
As I always write in this blog, if Models will be able to surf a normalization of markets with flat returns, I'd be happy. I think most investors will have deep losses in that environment

Sunday, November 13, 2016

THE WEEKLY VIEW- S&P, GOLD, TREASURY & EUR/GBP

Disclaimer: In this post I write my opinions and trading idea. If you choose to act like me, you are assuming your responsibility for your investment decision, because I could be wrong as every human being.

Good morning everybody, this week was quite volatile thanks to the unexpected (not for me, my office colleagues are witnesses :) ) Trump's victory. What surprised me was the market reaction. I believed that Trump was more equity friendly than Clinton, but I was quite confident that the initial reaction (at least for 1-2 weeks) would have been negative. My idea was a sort of pretty decent fall at the beginning, the break of 2000 level on S&P500, long short term traders washout, choppy markets for some weeks and new highs in 2017.
I was wrong on that, the fall lasted only few hours.

With this post I want to point out some variables to monitor in the following weeks, expected to be  volatile after the initial exuberance. I want to see it from a weekly chart point of view. It's a time period that I appreciate a lot and, according my experience, personal goals and character, is more adapt to realize what is going on. I also like monthly charts, while I don't like daily on indexes because of algos that can fake them easier

S&P500


Days ago I posted a similar chart on Twitter. I pointed out the risk of a Sma10-EMA20-30 weekly cross on the S&P500 in the next few weeks. In the last 2 times it happened, volatility increased sharply after the cross.
I want to point out few things:
  • Every bear market began with this bear cross, but not every cross leads to a bear market (so don't scream when it happens, just be alert).
  • In the last 2 events (Summer 2015 and beginning 2016) the cross came just close to the market bottom. But in the following 4 weeks market was very choppy
  • Note above how the white weekly candle of this week could remind the one of July 2015. The environment is not exactly the same for the index (S&P500 was flat at that time, while at the moment market is decreasing since August and S&P rose above a short term resistance. The environment is pretty similar for the moving averages shape.
SUMMARY: this positive week reduced the fear of a moving average cross in the next 1-2 weeks, but be careful that in a time frame longer than daily, technical situation continues to show weaking. Personally, I won't yell out "Beware to be long, the bear is out" because long-term trend is still up. I continue to think that, if market will fall sharply before end of year, it's still a buy opportunity when Vix rise around 28-30%

GOVERNMENT BONDS

This is the ETF Ishares Core US Treasury Bond, a proxy for the Treasury market. As we can see, the sell off was very sharp, but it is approaching a support area . Volatility could continue, but I believe that, at the moment is quite likely that the ETF will rebound at the first touch. I'd buy around 24.50 if touched to sell 0.80-1$ above on the rebound

GOLD

Gold is going to have a moving average bear cross. The question is...will it be like in 2013 or will be similar to the last few years,where gold was quite choppy after the cross? I think it's not yet ready to crash like in 2013. First the area between 1200-1150$ has many supports, second Gold suffered the fast rise in Governmente bonds interest rates and, as I said above, a rebound is likely short term. Important: the ETF gold amount is still rising, meaning that institutional investor are buying and the sell of is probably linked to future action (speculator?) I think Gold will go choppy in the coming weeks. I'd be a buyer if drops around 1150$ (Disclaimer: I've already have a long term structural Gold position).
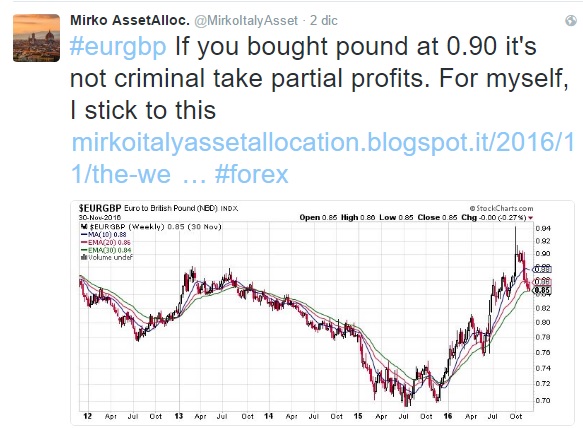
EUR/GBP

Let's return to the Brexit theme. Brexit had a temporary stop with the High UK Court decision. Now the word passes in January (probably) to the Supreme Court. In UK the chances of earlier elections increased, but the situation is quite random. Probably, neither the Premier Theresa May nor MPs know how they will act in 2017. I continue to buy sterling on weaknesses (I bought shy above 0,85 and above 0,90) but I'll wait the Supreme Court decision for the next purchases.
Technically uptrend is still strong and between 0,87 and 0,83 there's a strong support area. I'd be careful buying sterling further at this level after this strong week. Better buying on weakness.
I'd continue to be a seller of all Sterling, before Supreme Court decision, if Eur/Gbp fall towards 0,80 area. I could reduce exposure at 0,83.

Wednesday, November 2, 2016

November Allocations

Here the allocations for November.
Some models are suffering in these first days


Saturday, October 15, 2016

SEPTEMBER PERFORMANCE


These are the September Performance. I point out that I made a mistake with August performance as in model 3 the year to date returns were overstated. This tables are all manually filled and sometimes my eyes crossed each others with the multiple Excel Sheets I have. Monthly returns were correct indeed.

In September Models 1-2-3 had mixed performance, but with small gain or losses.  I am fine with the performances so far

 Models 4 had a mixed performance too, with a bit negative in Europe and positive in US


The performance year to date are satisfying so far. All models are positive in this global environment of NIRP rates.
I point out again, as someone asked me, that these performances are calculated on the ETFs benchmarks. Therefore in real, taking out bid/ask spread, transaction fees, taxes and slippage, results could diverge. I created this blog just to show that, with relative simple methods, you can surf on the markets  and add these strategies in a portfolio because they are not much correlated with equity markets

What I am waiting for is a waterfall scenario to test if Models have real muscles. I am curious to see how models will react in a new 2007-08 scenario. Backtest showed that most models had tough months in that period, but were quite ready to recover in the following months.
Unfortunately, at that time rates were higher and bond rally helped later. This time could be much tougher.

About markets, I was glad to see this month some selling pressure on global bonds, crude oil rally and inflation expectations rising. I think is too much important that global rates go higher than now, because there is a giant bubble

Many people point out about S&P500 being expensive, that stocks are a bubble because earnings are falling year to year. Maybe is true that stocks are not cheaper, but you have NIRP rates around the world....
if there is a bubble around this is to pay a government or a company to have the "honour" to borrow your money.
I can't understand how Central bankers created it....but maybe some of them begin to have doubts about their choices.

It will be tough in coming years to have good returns and/or save the capital. It's difficult to know if it will happen in the next 12 months (less likely) or within 24-48 months (likely), but I think a financial hurricane is coming unfortunately (2018?!?!?).


Saturday, October 8, 2016

Brexit Strategy - update (post 2)

In a previous post I wrote about my strategy to ride the Brexit event.

I explained about the high volatility future for the pound, that could lead to some losses on the currency.
But I also explained that I was beginning to buy sterling, because I thought that it would recover in the long term vs euro.
The Basic strategy was:
1) Buy between 0,85-1 vs euro (gradually. First 0,85- Second 0,90 and so on)
2) Sell sterling strength before art.50 triggering (ideally in area 0,80 that wasn't reached)

Because of recent flash-crash, yesterday I bought for the second time. At the moment I am at about 30% of my ideal £ sterling allocation. I am not planning to buy other pounds before to know if there will be the trigger in the first quarter 2017, unless eur/gbp doesn't reach area 0,95-1.

I'll hold position unless eur/gbp doesn't fall to 0,80

AS a reminder, I think that Brexit will be a long journey. This investment could be the same. Ideally the sterling position could be held for at least 1-2 years. I bought EIB bonds in £ with very short duration


Monday, October 3, 2016

October Allocations


Here the allocations for October. In coming days, September performances and considerations


Monday, September 19, 2016

PERFORMANCE AUGUST AND YEAR TO DATE


Here we are after deserved holidays.
I missed the increase in volatility in this first half of September, but is good...it was great to reload batteries. And I want to spend my 2cents on Greece and Greek people that were kind  with me in Crete. It's a quite sad that Europe is so demanding with them, when we have much more serious problems at the moment and we should realize that they'll never be able to repay their debt.

I highly recommend an holiday to Crete (More Info) that tourism is essential for them.


Going back to Models, August had a mixed performance, but results are satisfying year to date at the moment.
September is another month were models could suffer, because of weakness in Euro bond markets, but they don't try to anticipate the future. They follow the flow and go were investors like.
Not every year is the same, like in agriculture you must take what markets give. You can't manipulate it and market does what it wants, not what you hope or you'd like.


Thursday, September 1, 2016

September Allocations

I found time for the update before my holidays
August wasn't a very good month with mixed performances (I'll post it later in the month)
Personally I expect a quite volatile market in Autumn, let's hope models will be able to cope with vol-increase.

Have a nice month.


Note: I think I'll post next update around the September 20 after my holiday. If I'll see some interesting news/paper/articles I'll twitter them.

Sunday, August 28, 2016

S&P500 likes to "cheat" investors...

In this hot Sunday I feel myself inspired, maybe because my holidays weeks are getting closer.
I want to post this chart, to discuss how the S&P500 often likes to cheat investors


Can you see it? I show you what is see....

S&P500 likes to take stops of long investors and let people to scream about the next bear market.

Last Summer China brought volatility on the markets and S&P500 dropped below old important support (see first circle on the left about at 1980). At the same time many technicians called for a bear market looming because weekly MACD crossed below 0.
In few weeks S&P500 stabilized and rebounded.

 This January a similar situation happened driven by crude oil crash. S&P500 broke the support 1880 and MACD again crossed below 0.  Again many investors called for a crash...but S&P500 was able to stabilize and raise again.

Now it stands close to record. What could happen?
Don't know if S&P will fall soon or later, but this is the scenario that could drive many investors towards the bad trading decision and I am waiting for it:
* For any motive S&P500 could fall in September/October below 2000
* MACD could again cross below 0 and let investors screaming about a bear looming
* maybe the most dramatic call could arrive if index drops for few days below the 1800 support (but the fall could just stop earlier, around 1850-1900 because of huge cash around).

Well, it's difficult to say what is going to happen, but I continue to believe that 2016 is the year of US Equity market compared to Europe and on the next dip I'll be buyer after few days of stabilization.
To become pessimistic about US Equity I want to see Global Fund manager in strong overweight on US equity. At the moment, according the monthly survey by Bofa-ML, the overweight is light.


Brexit - My diversification strategy with Sterling

The Brexit Story could add an interesting investing opportunity for long term investors (I'm not going in the short term technical situation with this post).
It's difficult to time exactly when the Sterling will touch the bottom vs euro and US Dollar, because UK Authorities doesn't have a plan yet, but I decided to start buying Pounds now.

Below in the chart in the area where I plan to buy Pounds vs Euro in coming quarters in a gradual path.

Basically my "buy area" is between 0,85 and 1. It's a wide range, but Brexit is an unprecedent event and it's very difficult to build a future scenario.

Because of this uncertainty, I am going to buy "a piece" every 3-4 months above 0,85 and close the position if the cross drops towards 0,80 before art.50.

ASSUMPTIONS & RISKS
There's an high uncertainty about Brexit timing (UK Premier May said it could ask art.50 by April 2017). Actually is not sure if UK will never ask art.50 and/or if they'll call for another elections before asking it.

My base assumption is that:
 - when UK will ask art.50, Economy could suffer (or market will expect an economy slowdown) resulting in Sterling depreciation. If they ask within 2016 the depreciation could be this year towards 0,90
- If they delay the call too much, we  could have a temporary £ strengthening, followed by a renewed depreciation later in 2017 or 2018
- From a long term point of view, the Pound is undervalued vs euro and US Dollar.

Technically the trend is for a eur/gbp vs resistance 0,90 and $/£ vs 1,25 in next quarters.

Because at the moment we have RECORD net short  £ speculators positions  vs USdollar (see CFTC data(, the market is exposed to risk of a short term reversal, that could be deep. Especially vs USd, a rise of cable towards 1,40 would not reverse the long term bear trend! That would be a good place to reopen short sterling positions if it happens with Brexit risk still real (if it happens because they renounce  is another environment and the short could not be appropriate)

That's why I began to invest in Sterling. Not heavily, but I am adding gradually exposure.
At the moment I just put the "toe in the water" a shy above 0,85. I'll add if it rises to 0,90.


In Summary

  • Brexit timing is quite difficult to forecast, because also UK authorities don't know how and when do it (in my opinion)
  • Sterling lost a lot since Brexit referendum, Economy is not suffering yet and Speculators have record net short positions on the currency resulting in a "short squeeze" risk
  • I think it would be a nice moment to begin purchases of £ vs euro and $, not all in, but gradually. Personally I am going to buy above 0,85 eur/gbp every 4 months, and I'll be flexible with news. I'll close my position if in the short term the eur/gbp drops towards 0,80, because I think the Sterling needs to be weak to avoid recession when Art.50 is invoked. 
  • I am doing this strategy buing European Investment Bank bonds in £ that still have small positive yield, with a maturity between 2 and 3 years. If you are a US investor, you're lucky because you can also buy Gilts, hedge them and have an yield (hedged) much higher than your Treasury yield on the same maturity

Friday, August 12, 2016

July Performance


Here we go with the performance.
July was a very good month, because all models recorded positive returns.
Trend is back and they caught the juice... ;-)
You can see the monthly performances in the tables below. 


Below I show the Year-to-date returns graph  and I am glad to see all models positive. Model 4 US version is worse than benchmark, but it's fine. It is built to lag benchmark in bull markets, while overperforming strongly when the bear comes. Performance are in line with the risk of the models with Model 1 (safest) that as the lowest return and Models 3 (more aggressive) that have the highest retuns, in average.

I am satisfied because, this was a difficult year for many multi-asset funds and Models were able to cope with this market. Unfortunately it's becoming always more and more overvalued on most assets and dangerous because of this crazy NIRP World.
Let's hope models will be able to "limit the losses" when financial markets will enter in bear market.

To improve the universe of asset Models can invest, at the moment I am working on a project to diversify among almost 100 ETF. It will take time, but hope it will be finished within end of 2016


NOTE; Because of holiday, I don't know if I'll be able to post September Allocations at the beginning of the month. If I won't be able, I'll update them after approx 24 days. A bit late, just for diary purpose, but I need an holiday :)

Monday, August 1, 2016

August Allocation

Hi, Here we have the August Allocations.
I am very satisfied with July performance, I'll elaborate them further in next days.


Saturday, July 9, 2016

FIRST HALF 2016- RESULTS AND THOUGHTS

June was a very volatile month because of Brexit. Personally, I thought both sides were very close, but I thought the pro-remain would have won because of the tragic murder.
Instead Brexit side won and volatility increased. This will be a "chess" game and I don't think it will be over soon. I don't exclude new general elections in UK in 2017 if Parliament is not able to carry on with the Brexit proposal.

By the way, let's see the performances and analyze this first half of 2016.


Environment wasn't easy in the first part of 2016, because these models rely a lot on the fixed income side. It's true that yields are dropping fast worldwide and the trend is there (so far...), but with negative rates the most conservative Models (1 & 2) tend to suffer and become riskier.
This will be an important problem in the future, because they will be "forced" to go on more volatile assets, increasing volatility of models 1-2 returns and losing part of they prudent skill.

The Model 3 variants are more aggressive and can cope better with negative worlds, having more asset choices. But I fear their volatility will be higher than in the past too.

After these complains, let's write about something more juicy.

ALL models returns are positive year to date.

June was negative for conservative models (1 & 2) because of poor € high yield returns. Instead Model 3 (with its variants) had a very good month and performance ytd is quite satisfying for me.


Models 4 are simple. Basically they try to beat an equal weighted portfolio. They usually tend to underperform in strong positive markets and overperform  in bear markets.
Both European and US models are quite positive year to date. The 2 Europeans are beating benchmark at the moment, while the US are underperforming.
But I am satisfied. What I don't want to see is a benchmark very positive and models performance very negative.

SUMMARY: I am quite satisfied of 1H 2016 returns where many investors are licking their wounds.
I created this blog because it's quite easy to have impressive back-test results, but I liked to monitor models in real field. Of course there's no guarantee of positive returns in the future, but I think in the long term this models can help to surf the investing sea.

I repeat a answer I gave to a reader:
these are the returns of ETF benchmarks, therefore real investing retuns would be lower because bid/ask spread, ETF management fees, commission, slippage and, finally, tax issues. Performance are calculated supposing to invest at the close of the month. 
It's important to note that, very often, the enter price is not the lowest price in the following month....this means that there's almost always the chance to buy ETF at a lower price than entry model price in the next month.
Don't know if I was clear. If closing price of benchamrk ETF X in May is 100, model enters at 100.
Almost ever, in the following month (June), the ETF will drop below 100 for at least 1-2 days somewhere in the month.
Entering when it drops, could help the investor to have a performance more in line with the model...:)

NOTE: this blog is not an investing consulting services, therefore if you follow signal I'm not responsible for eventual losses. I'd be glad to receive just a thank you if you earn :)


Saturday, July 2, 2016

July Allocation

After big volatilty, finally, June was a very good month for performances....but I'll post about it later in the month.
Now these are July allocations.

Note: I point out to a mistake in model 4 $ June allocations: I wrote twice EM bonds allocation each 11,1%. Actually one was EM bonds, the other was HY $. I confused myself writing them, because it's all manual.


Tuesday, June 14, 2016

May performance


May was a tough month with model 3 suffering some reversal in assets.
Model 1-2 defended themselves being allocated on euro high yield.

On the other side, the super-diversified models 4 had a good month, even if they lagged their benchmarks. But it's built to give a better risk/reward rather than beat benchmark on absolute terms.


June is going to be a tough month as well, with abrupt moves caused by Brexit.
It ise an high volatility environment. In the last 2 days, euro high yield suffered a lot.
On the other side euro govies (core) are rallying with Bund 10y below 0% for the first time.
Dollar is rallying as well, together with Japanese yen, while European stocks crashed. Sterling is suffering as well, as Brexit -side is increasing support according to polls.

At the end of the month it could be a different story, if Brexit dosn't materialize, but what is sure is that with a zero-negative bond rates worldwide, is very difficult to have a good asset allocation.

"Thank you" Mario again...
i want to see how insurances and pension funds will be able in the future to offer decent returns...
NIRP is an extra-tax on our savings.

PS: don't know if in July, my models will allocate on euro bonds, but eventually, I won't invest in that signal . I can't accept to pay a government that borrows my money...

Thursday, June 2, 2016

June Allocations

Here the allocations for June.

The safest models continue to allocate in Euro HY because of the crazy NIRP World...

Gold exited from portfolios after the  recent weakness and S&P500 replaces it
New names appeared in some models


Saturday, May 14, 2016

Performances year to date

Here I am, PC is back and so far it works. Instead Excel has problems with the license, because it see the old PC as a new one and doesn't work. So I am using a third party PC.

I am going to post the performances for the first 4 months.
The good news is that all models are positive year to date, with April that was a good month (especially for safer models), while March was basically a bad one.
So far May isn't very good, because models increased exposure to euro high yield bonds that are suffering since 3 weeks. But so far the gain of previous month are higher (especially in model 1 & 2 that are the most defensive and where allocation of capital is higher).
Model 4 is beating the equal weighted benchmark in Europe, but not in US.

Unfortunately we are witnessing the "side-effect" of NIRP world (Negative Interest Rate Policy).
With short term bond negative, unless all assets become "funny", we are likely to see Model 1&2 going more on higher volatile assets. These are the most defensive models, designed to be low volatile. Is very likely that future model returns will be more volatile than the past and I don't like that at all...
"Thank you very much" Mario & Kuroda... "I love you"...

But this is what markets offers now. Probably in the future the most important thing will be wealth preservation rather than making money, because with NIRP is likely that average future returns will be lower than in the past for almost every asset.

I am still planning to build the "Big model" with the engine of model 3 plus many more asset classes (I'm thinking about 50 or 60). It takes time to do that and my time is not much at the moment, but I'll try to finish it within end of year. I want it ready before the next crisis. My aim is to build a version more defensive, one more aggressive and one with changing weighs.


OF course these models aren't perfect. I am not able to do that. I could have had best backtest returns with iper-hoptimization, but is not my scope. I think that KISS is the best thing (Keep it simple stupid) and the work that gives higher chances that in real a model will work. In the future it will be important to have a Compass for difficult financial moments.

I repeat a note, in real these returns will be lower because of transaction costs, ETF managements fees and taxes. Consider this issue.

Monday, May 2, 2016

Emergency May allocation

My pc continue to go & return from the tech office because they don't understand what is broken
I found an old pc for emergency but Excel version is quite old and I have troubles running my models.
By the way I was able to run them finally and I post an update of MAY ALLOCATION

Later in the month I'll post an update with the performances in the last 2 months.


Tuesday, April 12, 2016

Emergency April Allocation

My pc continues to be broken, but I calculated allocations using a pc from a friend of mine.
I'm going to post just "raw" allocations on the basics models and when I'll have my one (not before 10 days if I'm lucky) I'll post the full allocations for tracking history

MODEL 1 Euro High Yield 100%
MODEL 2 Euro High Yield 100%
MODEL 3 classic     Gold 50%   ---- Euro govies 15-30years  50%
MODEL 3.4   Gold 34% ----Euro govies 15-30years  33% - EM bonds local currency 33%


MODEL 4 €    Euro govies 56% ----- Emerging Bonds $ 11% --- euro HY 11% ---- Eurobonds 11% ---- Developed market properties 11%

MODEL 4$    Treasury 1-3y 34%  --- S&P500 11% ---- Emerging bonds $ 11% ----HY USA 11% ----- US Govies 11% ----Global bonds 11% ---- Developed markets properties 11%.

I wrote them down fast and did calculations quickly as well.
Hope there are not mistakes.

Bye bye

Tuesday, April 5, 2016

PC BROKE DOWN

this month I'll not be able to update allocations at the beginning of the month because of tech issues.

I'll post it later in the month for info purposes when I'll be able to reach a temporary pc.

Saturday, March 12, 2016

February Performances

February was a quite good month with all models that recorded positive performances.

Model 1& 2 continue to stay defensive and could struggle over the year with this negative yield environment...Central Banks (ECB.....) is not helping....
Model 3 recorded a positive performance thanks to $ and yen exposure, as well  good euro government bond environment.
Models 4 recorded a small positive gain and are overperforming their benchmark (it's quite common when stocks markets are weak).

March is going to be more difficult with an high dollar & bond volatility because of central banks action.

ECB used a nuclear weapon last week (it was unexpected for me the TLTRO with theoretically negative rates to banks...), let's see Fed what will say next week. I think the Fed will try to rise rates further in the year because they know that in the next recessions weapons will be exhausted.
ECB is already all in, signaling that situation on this side of the Ocean is quite bad...

Let's surf this market in 2016, but it will be an high volatility environment.


Wednesday, March 2, 2016

March Allocation

Few changes for March. February was a good month for us
Later in the month I'll publish performances and considerations


Saturday, February 27, 2016

A nice video about real hard trader life


everyone would like to be a trader to make big money, but how many have the skill (tech &psyco) to do it?

Saturday, February 13, 2016

Performances and considerations

In the previous post at the beginning of the month I posted the February allocations.
I'm going to re-publish them with a new format that can help the reading


This beginning of the year was very tough, with an incredible volatility and some long term trends that reversed or arrived close to give the sell signal. Economy is slowing down but yield curve doesn't forecast an US recession within 12 months. Some analysts argue that yield curve could be affected by ZIRP rate around the world (somewhere is NIRP too, ie negative interest rate policy), but I want to believe that curve can maintain its forecast skill now. By the way, what seems sure is that there's a strong slowdown in global economy, especially in Emerging Markets and in manufacturing industry Because of ZIRP that created overcrowded positions on some assets, market overreacted to these fears caused by China, crude oil, bad macro data.
I'm pleased that models were able to avoid the huge volatility and closed mixed. Of course in a zero interest rate world, it's difficult to stay on safe assets for long times.
Below you can see the summary


Safe Model 1 closed slightly above 0% and continue to remain defensive.
Model 2 benefited from end of month inflation bonds rally and switched safe for this month.
Models 3 had mixed performances
Models 4 were mixed as well, outperforming their Benchmarks (equal weighted portfolios).

Trading signal (call spread on the European stocks) is losing money, but I'm glad i chose this strategy that has a defined maximum loss because of long term deterioration patterns in the equity.

For this month we have long term bond, dollar & yen  exposure and the two safest models are on cash. It's an interesting month with volatility that continue to be high. Luckily we have just a very small exposure on equity (model 4$ equity bias).
In this environment, I'm happier to avoid huge roller-coasters than doing equity bottom hunting.


Monday, February 1, 2016

February allocations

FEBRUARY ALLOCATIONS (preliminary)

MODEL 1 - Euro govies 1-3 years or sight deposits with a positive rate. 100%

MODEL 2 -  Euro govies 1-3 years or sight deposits with a positive rate. 100%

MODEL 3 - Euro govies 15-30 years            50%
                     Treasuries 7-10 years                 50%

MODEL 3 (more aggressive) *** - Euro govies 15-30 years            50%
                                                           Treasuries 7-10 years           50%

MODEL 3 Variable weights ***    Euro govies 15-30 years            52%
                                                           Treasuries 7-10 years           48%

MODEL 3.4    Global convertible     bonds                                  34%
                       Japanese bonds                                                    33%
                       Treasuries 7-10 years                                           33%

MODEL 3.4 Variable weights ***  Global convertible     bonds    28%
                       Japanese bonds                                                     35%
                       Treasuries 7-10 years                                            37%

MODEL 3.4 (more aggressive) ***      Global convertible     bonds       34%
                       Japanese bonds                                                             33%
                       Treasuries 7-10 years                                                    33%

MODEL 3.5  ***      Govies euro 15-30y                                             34%
                                Treasuries 7-10 years                                           33%
                                Global convertible     bonds                                  33%
                 
MODEL 4 € Euro govies 1-3 years or sight deposits with a positive rate    66,7%
                      Emerging sovereign bonds                                                11,1%
                      Euro government bonds                                                    11,1%
                      Global  bonds                                                                  11,1%

MODEL 4 € equity push Euro govies 1-3 years or sight deposits with a positive rate    66,7%
                      Emerging sovereign bonds                                                11,1%
                      Euro government bonds                                                    11,1%
                      Global  bonds                                                                  11,1%                                                                 11,1%

MODEL 4 USA             Treasury Short term 1-3y  88.9%
                                      US Treasury                   11,1%
                                     

MODEL 4 USA equity push      ***              Treasury Short term 1-3y  77.7%
                                                                    S&P500                            11,1%
                                                                    US Treasury                   11,1%

In coming days I'll post comments
                                                                   

Saturday, January 16, 2016

A look at long term trends (and almost ready for a bull call spread)

Hi,
because of the beginning year very strong volatility, I decided to write this post to analyze long term trend in main asset classes (S&P500, Euro Stoxx, Nikkei, euro and US HY, Emerging bonds, euro and US govies). 
I do it monitoring the long term moving averages (on monthly basis) that are less "manipulable" by algos. Of course they continue to have the classic moving averages defects.
I decided to write this post because fundamentals are getting worse: US data are disappointing, China data as well and crude oil is collapsing. I don't go into further details unless someone ask me it explicitly, but what one must realize is that there are 2 opposite long term scenario for 2016-17

The First one is that this year is just like 2007/early 2008 and we lead toward a global recession with a drastic drop in the asset valuations
The Second one is opposite. Now is the scariest moment (like in 2011) but world will avoid recession and equity markets will return in an uptrend.

Have a look at the following moving averages and you'll see that we are in a situation similar to both 2007 and 2011. In stocks markets the moving averages are beginning to reverse down and prices are already below. But moving averages didn't cross yet on stocks.


S&P500: reminds 2011 so far


Euro Stoxx: high volatility just like in 2011

Nikkei: similar to 2008, but is choppier than other indexes


 Emerging bonds $: trend still up, stronger than 2008 so far

Euro HY: weakening signals, trend close to reversal just like 2007

 Euro governments 7-10y: trend is up

 Treasury 7-10 years: trend is up

 US High Yield already in downtrend like in 2008

In summary equities markets are now in downtrend, just like US HY.
Euro HY are on the "edge" of downtrend, while intermediate govies continues to trend up


The long term trends send a warning signal but, on the other side, the very high oversold equity situation offers a chance to play for a rebound.
In my opinion, I continue to be optimistic that the world will not fall in the recession this year. On the other side, we have now a more crowded situation on risk assets, because of negative rates on short term bonds and this increase the risk of flash crashes. Sovereign funds are probably selling strong too  because of crude oil drop.
I think that I'm going for myself to play a rebound for march, but using a bull call spread. That's because if I am wrong, the downside is high. An entry level could be around 300 in the Euro Stoxx to play for a 5% rebound. (use it for timing on Dax or Ftsemib or eurostoxx 50)


And I'll continue to allocate monthly like usual the rest of capital.
Stay tuned, markets in 2016 are going to be interesting.