R.I.P.
Sunday, September 13, 2015

Sunday, September 6, 2015
September Allocation
Unfortunately my holiday were deleted and not because of financial markets....
By the way, I'm going to update with a short post the September allocation
MODEL 1 - Euro gov 1-3y or in alternative sight deposits with a plus rate (100%)
MODEL 2 - Euro gov 1-3y or in alternative sight deposits with a plus rate (100%)
MODEL 3 - Euro gov 1-3y or in alternative sight deposits with a plus rate (50%)
Euro high yield (50%)
MODEL 3.v4 - Euro gov 1-3y or in alternative sight deposits with a plus rate (34%)
Japanese government bonds (33%)
Euro floating rates (33%)
Below the table and the chart with monthly and year to date (YTD) performance


Corrections: In August allocation Model 2 YTD return was wrong. The real one was 5,06% (ie 5,1%) instead of 5,6% I wrote.Model 3 YTD was wrong as well in the table. The line graph performance was correct.
MODEL 4 -Euro govies 1-3 years or sight deposit with a positive rate (100%)
at the moment it continues to underperform EW benchmark approx 6% this year
MODEL 4 US - US Treasuries 1-3 years (89%)
Global bond (11%)
at the moment it is underperforming EW benchmark by 0.8%.
it's normal it's underperforms in momentum reversal market. It's scope is to avoid huge losses over long term.
SUMMARY: in a market where momentum seems over, models are suffering but continue to be positive year to date. Now they are positioned very defensive expecting for a clearer direction in coming months. It's a pity that short term rates are negative for institutional and this mean losing money. As a retail people, is still possible to take a positive rate, or at least 0% on sight deposits
By the way, I'm going to update with a short post the September allocation
MODEL 1 - Euro gov 1-3y or in alternative sight deposits with a plus rate (100%)
MODEL 2 - Euro gov 1-3y or in alternative sight deposits with a plus rate (100%)
MODEL 3 - Euro gov 1-3y or in alternative sight deposits with a plus rate (50%)
Euro high yield (50%)
MODEL 3.v4 - Euro gov 1-3y or in alternative sight deposits with a plus rate (34%)
Japanese government bonds (33%)
Euro floating rates (33%)
Below the table and the chart with monthly and year to date (YTD) performance


Corrections: In August allocation Model 2 YTD return was wrong. The real one was 5,06% (ie 5,1%) instead of 5,6% I wrote.Model 3 YTD was wrong as well in the table. The line graph performance was correct.
MODEL 4 -Euro govies 1-3 years or sight deposit with a positive rate (100%)
at the moment it continues to underperform EW benchmark approx 6% this year
MODEL 4 US - US Treasuries 1-3 years (89%)
Global bond (11%)
at the moment it is underperforming EW benchmark by 0.8%.
it's normal it's underperforms in momentum reversal market. It's scope is to avoid huge losses over long term.
SUMMARY: in a market where momentum seems over, models are suffering but continue to be positive year to date. Now they are positioned very defensive expecting for a clearer direction in coming months. It's a pity that short term rates are negative for institutional and this mean losing money. As a retail people, is still possible to take a positive rate, or at least 0% on sight deposits
Thursday, August 6, 2015
August Allocations
Here we go with August allocations that are confirmed as I wrote fast in the previous draft.
MODEL 1: euro govies 1-3 years (if you can use cash sight deposit with a "+" rate)
MODEL 2: euro govies 1-3 years (if you can use cash sight deposit with a "+" rate)
MODEL 3: 1) euro govies 1-3 years (if you can use cash sight deposit with a "+" rate) and
2) euro high yield corporate bond
MODEL 3.v4: 1) euro govies 1-3 years (if you can use cash sight deposit with a "+" rate) and
2) euro govies floaters
3) global corporate bonds
All models recovered some or/all June losses in July continuing to be positive at the middle of the year. Most aggressive models recovered only a small amount of June losses.
Below you can see the table with monthly and ytd performance and relative chart


I want also to update the latest models (Model 4) that run versus a benchmark. You can find description in the post about MODEL 4 and MODEL 4 US Style. August allocations are:
MODEL 4: euro govies 1-3 years (if you can use cash sight deposit with a "+" rate)
MODEL 4 US: 1) 89% US treasuries 1-3 years (if you can use cash sight deposit with a "+" rate)
2) 11% S&P500
MODEL 4 performed 2,1% ytd vs 7,7% benchmark Equal-Weighted, therefore underperforming at the moment
MODEL 4 US performed almost flat ytd (0,2%) vs 0,9% benchmark return, slightly under-performing.
(note: since August Bloomberg denied access to previous govies 1-3y index, therefore I was forced to find another substitute that is not the SHY etf benchmark)
CONCLUSION: after a very good beginning of year my momentum models suffered the "back to reality" events, especially in April and June when there was many strong countertrend moves. Nevertheless all models 1-2-3 are positive in this 2015 covering ETF managements expenses and trade commissions
Most recent models (Models 4) are basically flat that isn't a great result. They're doing a bit worse than benchmarks
NOTE: September allocations will be updated with a strong delay because of my holiday. I think I won't be able to update it before 17-18 September therefore will be useful just for trackrecord but not for real monthly allocation. I'll stay cash with my money while I can't monitor markets.
MODEL 1: euro govies 1-3 years (if you can use cash sight deposit with a "+" rate)
MODEL 2: euro govies 1-3 years (if you can use cash sight deposit with a "+" rate)
MODEL 3: 1) euro govies 1-3 years (if you can use cash sight deposit with a "+" rate) and
2) euro high yield corporate bond
MODEL 3.v4: 1) euro govies 1-3 years (if you can use cash sight deposit with a "+" rate) and
2) euro govies floaters
3) global corporate bonds
All models recovered some or/all June losses in July continuing to be positive at the middle of the year. Most aggressive models recovered only a small amount of June losses.
Below you can see the table with monthly and ytd performance and relative chart


I want also to update the latest models (Model 4) that run versus a benchmark. You can find description in the post about MODEL 4 and MODEL 4 US Style. August allocations are:
MODEL 4: euro govies 1-3 years (if you can use cash sight deposit with a "+" rate)
MODEL 4 US: 1) 89% US treasuries 1-3 years (if you can use cash sight deposit with a "+" rate)
2) 11% S&P500
MODEL 4 performed 2,1% ytd vs 7,7% benchmark Equal-Weighted, therefore underperforming at the moment
MODEL 4 US performed almost flat ytd (0,2%) vs 0,9% benchmark return, slightly under-performing.
(note: since August Bloomberg denied access to previous govies 1-3y index, therefore I was forced to find another substitute that is not the SHY etf benchmark)
CONCLUSION: after a very good beginning of year my momentum models suffered the "back to reality" events, especially in April and June when there was many strong countertrend moves. Nevertheless all models 1-2-3 are positive in this 2015 covering ETF managements expenses and trade commissions
Most recent models (Models 4) are basically flat that isn't a great result. They're doing a bit worse than benchmarks
NOTE: September allocations will be updated with a strong delay because of my holiday. I think I won't be able to update it before 17-18 September therefore will be useful just for trackrecord but not for real monthly allocation. I'll stay cash with my money while I can't monitor markets.
Monday, August 3, 2015
AUgust Allocation draft
It was a busy beginning of week.
I made preliminary calculation for allocation, but couldn't check properly because of personal issues.
At the moment it seems that allocations are the same of July for Model 1-2-3 and 4 EU style
The model 3.23 assets changed something and I still have to open the US model
I'll update more in the coming days, maximum next week end
For sure model 1 and 2 stay cash, model 4 100% cash and model 3 confirmed HY & cash
I made preliminary calculation for allocation, but couldn't check properly because of personal issues.
At the moment it seems that allocations are the same of July for Model 1-2-3 and 4 EU style
The model 3.23 assets changed something and I still have to open the US model
I'll update more in the coming days, maximum next week end
For sure model 1 and 2 stay cash, model 4 100% cash and model 3 confirmed HY & cash
Wednesday, July 29, 2015
MODEL 4 (US STYLE) - beating benchmark
In this post I show the US version of MODEL 4 (in the previous post it was from an € investor point of view)
I used 9 asset and calculated returns with the benchmark of most traded US ETF
again the asset classes are:
1) Treasury 1-3 years
2) Treasury 10 years
3) Global corporate bonds
4) US equity S&P500
5) MSCI Eafe
6) Emerging bond $
7) Commodity generic index
8) $ High Yield
9) Developed Market Properties yield
I can give you Bloomberg ticker if interested
Chart below show that the US MODEL 4 beats the Equal Weighted portfolio in the long run

The table shows that over the long term risk-adjusted returns are far better than a simple EW portfolio. The model beats the simple risk-free rate (TBill 3months)

Like in the € version, MODEL4 obtains its overperformance thanks to the defensive position in bear markets. When there's a strong "risk on" environment, it tends to underperform.

July Allocation: 100% cash
I used 9 asset and calculated returns with the benchmark of most traded US ETF
again the asset classes are:
1) Treasury 1-3 years
2) Treasury 10 years
3) Global corporate bonds
4) US equity S&P500
5) MSCI Eafe
6) Emerging bond $
7) Commodity generic index
8) $ High Yield
9) Developed Market Properties yield
I can give you Bloomberg ticker if interested
Chart below show that the US MODEL 4 beats the Equal Weighted portfolio in the long run
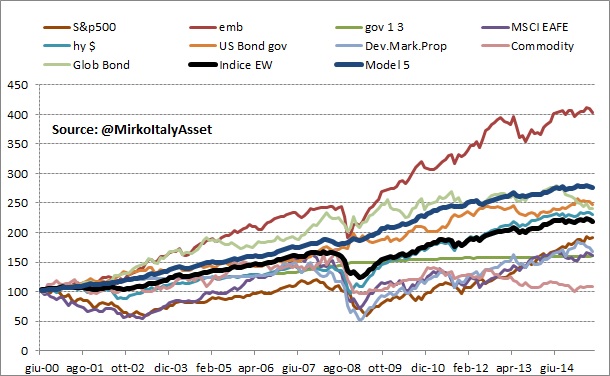
The table shows that over the long term risk-adjusted returns are far better than a simple EW portfolio. The model beats the simple risk-free rate (TBill 3months)


Like in the € version, MODEL4 obtains its overperformance thanks to the defensive position in bear markets. When there's a strong "risk on" environment, it tends to underperform.

July Allocation: 100% cash
Saturday, July 11, 2015
Model 4 - beating benchmark over the Long Term (updated)
Note: I updated this post because I found a bug in the return calculation while building this same model with US ETF. Basically the return was wrong for €bonds 1-3years as I took another asset. With correct benchmark, the risk/return parameters improve, validating the strength of model.
In this post I want to show a model I developed that is different from the previous I posted.
While model 1, 2 and 3 were absolute returns models, ie trying to close basically positive in the long term, reducing downside risk, MODEL4 try to beat a benchmark with a better risk/return
BENCHMARK
I suppose that my universe is composed by 9 assets that can be a proxy of major asset classes for an European investor. I replicate them with ETFs.
CASH: as proxy I use Ishares € government 1-3 years because negative rates (in real as retail you can also use a sight deposit with positive/zero rate)
BOND:
MODEL vs BENCHMARK
MODEL 4 is able to beat benchmark over long term mostly by reducing draw-down in difficult environments.
Below you can see the graph where the MODEL (dark blue) outperforms the EW portfolio (black line). You can see also the returns of others asset classes in the same period of time.

The table below confirms the outperformance. MODEL 4 returns approx only 1% a year more than benchmark over the long term, but the huge difference is the draw-down and the volatility. MODEL 4 contain the max DD at less than 3%, while EW portfolio lost more than 27% once. You slept definitively better with the model even if returns are not much higher. And in the long term MODEL 4 (but also the EW portfolio) outperformed the risk free rate (Eonia).

PRO & CONS
I want to show a quality (and a defect) of the model. In the chart below you can see the ratio MODEL 4/EW portfolio. Basically when line rise the MODEL outperforms the benchmark and vice versa. You can see that there's a strong outperformance when there were stress on markets as 2007/08 and 2001/02. Instead when the market is in strong "risk on" phase, the MODEL tends to underperform from a simple return point of view.
This is a quality that I appreciate because it's "natural" and not overfitted.
My goal is always to find models that can continue to work in the future with high probability, therefore I believe that is important to not overfit. I have a clear trading concept, I put on place and don't go to see if modifying one parameters it improves. What I do is to have the idea and see if, changing parameters, the idea works with stable results.
If it doesn't work, it goes in the garbage. For example, I dont' use in this model moving averag, but just to explain the concept: if it works with 60days, doesn't with 100days, works with 120 and works so so with 200, for me it goes in the garbage :)

CONCLUSION
MODEL 4 in the past was able to outperform an Equal-weighted portfolio with 9 asset classes from an European investor side. Returns were not a lot superior, but the biggest difference is the more conservative approach that avoid the drawdown. I accept the underperform in the "risk on" situation because I know that with an high probability MODEL will outperform in long term with much lower draw dawn that help me to sleep better.
Just to be fair: Year to date the model underperforms the EW portfolio.
At the end of June EW returns7,2%, while MODEL 4 returns just +1.6%. Therefore it shows that is not overfitted otherwise I would have posted a better result :)
Allocation for JULY: 100% euro government 1-3 years. Very defensive. Don't know how Greek situation will evolve, maybe I'll lose a relieve rally, but I sleep very well :)
I'll update it with the other montlhly allocation post every month in this 2015.
In this post I want to show a model I developed that is different from the previous I posted.
While model 1, 2 and 3 were absolute returns models, ie trying to close basically positive in the long term, reducing downside risk, MODEL4 try to beat a benchmark with a better risk/return
BENCHMARK
I suppose that my universe is composed by 9 assets that can be a proxy of major asset classes for an European investor. I replicate them with ETFs.
CASH: as proxy I use Ishares € government 1-3 years because negative rates (in real as retail you can also use a sight deposit with positive/zero rate)
BOND:
- ishares Core euro government bond (proxy for € govies)
- ishares JP Morgan $ emerging markets (proxy for emerging market bonds)
- Ishares € high yield corporate bond (proxy for euro high yield bonds)
- Ishares global government bond (proxy global bond market)
- ishares MSCI EMU (proxy for euro equity)
- ishares MSCI World (proxy for world equity)
- Ishares developed markets property yield (proxy real estate)
- Bloomberg commodity index euro (proxy for commodity and benchmark for some Etf)
MODEL vs BENCHMARK
MODEL 4 is able to beat benchmark over long term mostly by reducing draw-down in difficult environments.
Below you can see the graph where the MODEL (dark blue) outperforms the EW portfolio (black line). You can see also the returns of others asset classes in the same period of time.

The table below confirms the outperformance. MODEL 4 returns approx only 1% a year more than benchmark over the long term, but the huge difference is the draw-down and the volatility. MODEL 4 contain the max DD at less than 3%, while EW portfolio lost more than 27% once. You slept definitively better with the model even if returns are not much higher. And in the long term MODEL 4 (but also the EW portfolio) outperformed the risk free rate (Eonia).


PRO & CONS
I want to show a quality (and a defect) of the model. In the chart below you can see the ratio MODEL 4/EW portfolio. Basically when line rise the MODEL outperforms the benchmark and vice versa. You can see that there's a strong outperformance when there were stress on markets as 2007/08 and 2001/02. Instead when the market is in strong "risk on" phase, the MODEL tends to underperform from a simple return point of view.
This is a quality that I appreciate because it's "natural" and not overfitted.
My goal is always to find models that can continue to work in the future with high probability, therefore I believe that is important to not overfit. I have a clear trading concept, I put on place and don't go to see if modifying one parameters it improves. What I do is to have the idea and see if, changing parameters, the idea works with stable results.
If it doesn't work, it goes in the garbage. For example, I dont' use in this model moving averag, but just to explain the concept: if it works with 60days, doesn't with 100days, works with 120 and works so so with 200, for me it goes in the garbage :)


CONCLUSION
MODEL 4 in the past was able to outperform an Equal-weighted portfolio with 9 asset classes from an European investor side. Returns were not a lot superior, but the biggest difference is the more conservative approach that avoid the drawdown. I accept the underperform in the "risk on" situation because I know that with an high probability MODEL will outperform in long term with much lower draw dawn that help me to sleep better.
Just to be fair: Year to date the model underperforms the EW portfolio.
At the end of June EW returns7,2%, while MODEL 4 returns just +1.6%. Therefore it shows that is not overfitted otherwise I would have posted a better result :)
Allocation for JULY: 100% euro government 1-3 years. Very defensive. Don't know how Greek situation will evolve, maybe I'll lose a relieve rally, but I sleep very well :)
I'll update it with the other montlhly allocation post every month in this 2015.
Thursday, July 2, 2015
JULY ALLOCATIONS
Here we come, 6 months after the launch of these models in the blog
Last months showed some trend reversal, especially in the bond world and models suffered. But so far all models are positive year to date, although many profits were gone.
In June MODEL 1&2 were on the defensive path. Unfortunately short term euro gov bonds lost value in that month, therefore there were small monthly losses (not if u invested in a sight deposit with positive rate instead of bonds).
These are the July allocations
MODEL 1 - Euro government bond 1-3 years (confirmed)
MODEL 2 - Euro government bond 1-3 years (confirmed)
MODEL 3 - Euro government bond 1-3 years - euro high yield (switched from emerging bonds and Treasuries)
I also want to show and track constantly the MODEL 3.4 that I highlighted in previous post. It allocates on 3 ETFs each month. This is a bit more volatile than former MODEL 3, but adds diversification. Of course there are more switches and you need low commissions, otherwise is better the former model with 2 ETFs.
MODEL 3.4 - Euro government bond 1-3 years - euro high yield - euro floaters rate (switched from emerging bonds, Treasuries and global bonds)
Below you can see the table with 2015 gross monthly returns and the charts.
Later this month I'm going to publish a new model, with different philosophy that is useful for a portfolio that want a multiasset exposure for most of the time.


Last months showed some trend reversal, especially in the bond world and models suffered. But so far all models are positive year to date, although many profits were gone.
In June MODEL 1&2 were on the defensive path. Unfortunately short term euro gov bonds lost value in that month, therefore there were small monthly losses (not if u invested in a sight deposit with positive rate instead of bonds).
These are the July allocations
MODEL 1 - Euro government bond 1-3 years (confirmed)
MODEL 2 - Euro government bond 1-3 years (confirmed)
MODEL 3 - Euro government bond 1-3 years - euro high yield (switched from emerging bonds and Treasuries)
I also want to show and track constantly the MODEL 3.4 that I highlighted in previous post. It allocates on 3 ETFs each month. This is a bit more volatile than former MODEL 3, but adds diversification. Of course there are more switches and you need low commissions, otherwise is better the former model with 2 ETFs.
MODEL 3.4 - Euro government bond 1-3 years - euro high yield - euro floaters rate (switched from emerging bonds, Treasuries and global bonds)
Below you can see the table with 2015 gross monthly returns and the charts.
Later this month I'm going to publish a new model, with different philosophy that is useful for a portfolio that want a multiasset exposure for most of the time.


Subscribe to:
Posts (Atom)